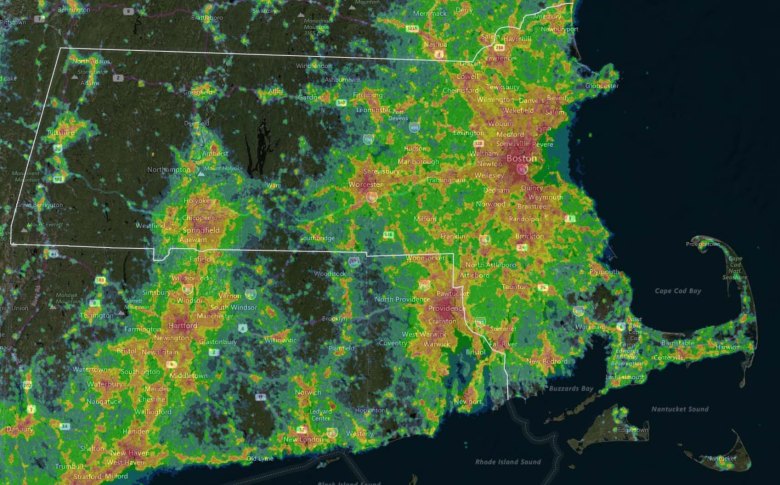
Space scientists have been tracking the spread of light pollution for decades using nighttime imagery from orbiting spacecraft. The first maps came from scanners on Defense Meteorological Satellite Program (DMSP) satellites. Since 2011, with the launch of the Suomi NPP satellite, a more sensitive system known as the Visible Infrared Imaging Radiometer Suite (VIIRS) has been recording the nightscape below. Maps of VIIRS images show much greater detail, though the camera sensors are not very sensitive to the crucial blue wavelengths that scatter in the atmosphere most strongly.
This light-pollution map of Massachusetts was recorded by VIIRS in 2016. It’s color-coded from least (black) to most (red) light received coming from the ground below. Click on the image to display a higher-resolution view big enough to show areas close to your home. Or click here to explore this map interactively — or to compare it with light-pollution maps compiled by DMSP sensors in 2010 and annually by VIIRS since 2013